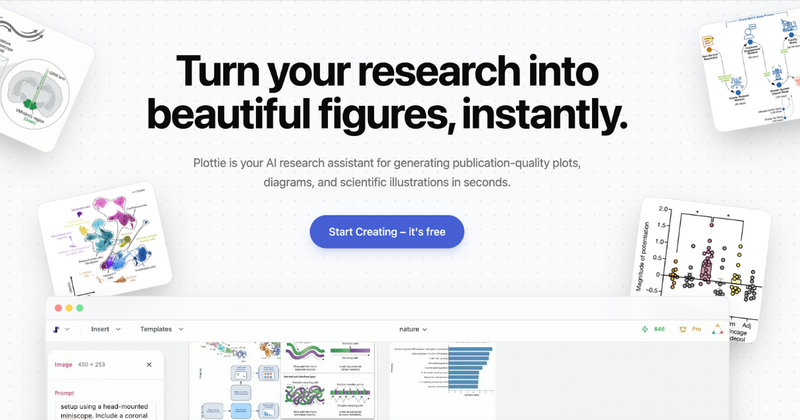
Plottie is an AI-powered research assistant that transforms raw data or text descriptions into publication-quality scientific plots, diagrams, and illustrations in seconds, without requiring coding or expensive software licenses.
What is Plottie?
Plottie is a web-based tool that takes input data (CSV, TSV, TXT, or Excel files) or natural language descriptions and outputs high-resolution, publication-ready figures including statistical plots, flowcharts, and scientific diagrams. It is designed specifically for academic researchers and runs entirely in the browser, with no installation needed.
Key Features
- No-code scientific visualization — Generate complex plots (volcano, MA, heatmap, boxplot, etc.) directly from raw data without any programming knowledge.
- AI-powered plot recommendations — Automatically analyzes your data structure and suggests the most appropriate visualization for your scientific story.
- Domain-specific AI models — Unlike generic image generators, Plottie uses models fine-tuned on scientific literature to ensure biologically and chemically accurate diagrams, avoiding hallucinated labels or structures.
- Vector export (SVG/PDF) — Export figures as scalable vector graphics for crisp reproduction in papers and posters, with standard-resolution free exports and high-resolution available in Pro plans.
- Infinite canvas with smart layout — Organize multiple plots, diagrams, and notes on an infinitely zoomable whiteboard; AI can auto-arrange elements for manuscript-ready layouts.
- Editable text layers — All generated diagrams preserve text as editable layers, allowing you to correct typos, adjust fonts, or translate labels before export.
- Automatic data type detection — The tool identifies column types and variable relationships to recommend the best chart type without manual specification.
Who is it for?
- Academic researchers — Replace time-consuming matplotlib scripts or GraphPad Prism workflows with instant, publication-quality figures from raw experimental data.
- PhD students and postdocs — Create polished figures for journal submissions, thesis chapters, and conference posters without learning complex software.
- Science communicators — Generate clear, accurate illustrations and diagrams for presentations, educational materials, or public outreach.
- Lab technicians — Quickly visualize routine assay data (e.g., growth curves, replicate measurements) with minimal effort.
What can you do with Plottie?
- Turn raw data into publication-ready plots — Upload a CSV of experimental measurements (e.g., batch growth data) and get statistically appropriate plots like boxplots or volcano plots with one click.
- Convert methodology text into flowcharts — Paste a methods section or protocol; Plottie extracts logical steps and generates a clean, step-by-step flowchart in seconds.
- Create scientific illustrations — Describe a biological structure or process (e.g., a DNA replication fork) and receive an accurate, labeled vector diagram suitable for manuscripts.
- Organize figures on an infinite canvas — Combine multiple plots, diagrams, and notes on a single zoomable workspace, then use smart layout to auto-arrange them for paper submission.
How does Plottie work?
- Drop a CSV/TSV/TXT/Excel file onto the upload area, or type a description of the illustration you need.
- Plottie's AI analyzes the data or text: detects variable types for data, or parses the description for diagrams.
- Select from recommended plot types (e.g., volcano, MA, heatmap) or let the tool generate the illustration automatically.
- Fine-tune labels, colors, and layout using the built-in editor, then export as SVG or PDF.
Pros and cons
- Pros: No coding required; domain-specific accuracy; fast generation (seconds); free tier with unlimited standard plots; high-resolution vector exports (Pro).
- Cons: Free exports are limited to standard resolution; advanced AI features require a Pro plan; currently web-only (no desktop app).
Pricing
Plottie offers a generous free tier that includes unlimited plot generation and standard-quality exports. Pro plans provide high-resolution SVG/PDF exports and additional AI features (exact pricing not disclosed on the public page).
FAQ
Is Plottie free?
Yes, Plottie has a free tier that lets you generate unlimited plots and export them in standard quality. Pro plans are available for high-resolution vector exports and advanced features.
Do I own the copyright to images generated?
Yes, you own 100% of the rights. All images and charts are royalty-free and can be used in academic publications, posters, and presentations without further permission.
Is my uploaded data used to train the AI?
No. Plottie does not use your uploaded datasets or private prompts to train public models. Your research data remains confidential.
Can I export to SVG/PDF?
Yes, high-resolution SVG and PDF exports are available on Pro plans. The free tier exports at standard resolution, but still in a crisp vector format.
Can I edit text in generated diagrams?
Absolutely. Plottie produces editable text layers, so you can correct typos, translate terms, or adjust fonts directly before exporting.