
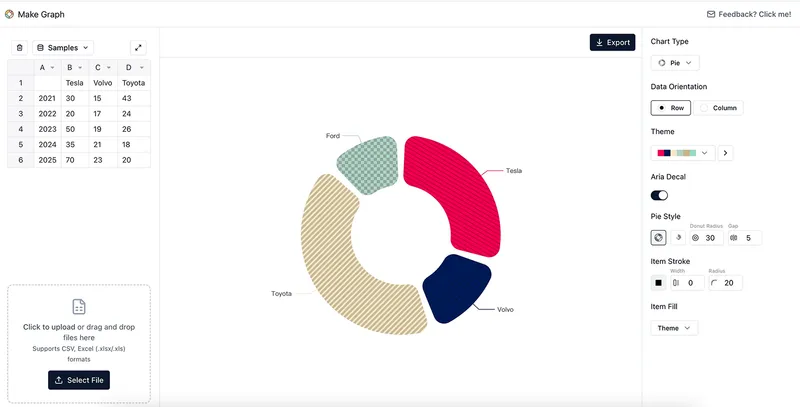
Make Graph is a free online chart maker that lets you create professional charts and graphs directly in your browser without any registration or downloads. Get started at Make Graph editor.
What is Make Graph?
Make Graph is a web-based chart creation tool that takes your data (numbers, categories, or text) and produces customizable charts in common formats such as bar, line, pie, scatter, radar, funnel, heatmap, word cloud, map, and boxplot. It runs entirely in the browser, so no software installation is required. The tool is developed by an independent team and emphasizes privacy by keeping all data local to your device.
Key Features
- 8+ Professional Chart Types — Create bar, line, pie, scatter, radar, funnel, heatmap, word cloud, map, and boxplot charts. Each type is designed for specific data visualization needs.
- Beautiful Themes — Choose from multiple professionally designed color themes that apply instantly to your charts, helping maintain brand consistency across presentations.
- Accessibility Features — Enable Aria Decal patterns to add visual textures to chart elements, making them distinguishable even for users with color vision differences or when printed in grayscale.
- No Sign-up Required — Start creating immediately without creating an account. Your data stays in your browser and is never stored on external servers.
- Export Options — Download charts as PNG or SVG files for use in presentations, reports, or documents.
- Templates — Jumpstart with ready-made templates such as Basic Bar Chart (Use Template), Basic Line Chart (Use Template), and Donut Chart (Use Template). View all templates here.
- Lightning Fast — Create charts in seconds with an intuitive interface that updates in real time as you input data.
Who is it for?
- Students and Educators — Create clear visualizations for homework assignments, research papers, or classroom presentations without needing specialized software.
- Business Professionals — Generate charts for quarterly reports, dashboards, or internal meetings quickly, with export formats suited for slide decks.
- Researchers and Analysts — Explore data patterns with scatter plots, heatmaps, or boxplots, and share results as images or in publications.
- Content Creators — Produce custom charts for blog posts, infographics, or social media using the word cloud or map types.
What can you do with Make Graph?
- Visualize sales data — Use bar charts to compare product performance across regions, with customizable colors and labels.
- Track trends over time — Plot time-series data on line charts, then download the chart as a high-resolution PNG for your report.
- Highlight text frequency — Create word clouds from customer feedback or article text to quickly identify recurring terms.
- Show geographic distributions — Use the map chart to plot data by country or region, ideal for global sales maps or demographic visualizations.
Pricing
Make Graph is completely free. There are no paid tiers, subscription fees, or watermarks on exported charts. All features, including all chart types, themes, and export formats, are available without any cost.
FAQ
Is Make Graph free?
Yes, Make Graph is entirely free to use. There are no hidden costs, watermarks, or paid upgrades. All features are included at no charge.
Do I need to create an account?
No, you do not need to sign up or log in. The tool works directly in your browser, and your data is never sent to a server.
What chart types are available?
Make Graph offers over ten chart types: bar, line, pie, scatter, radar, funnel, heatmap, word cloud, map, and boxplot. You can access each from the chart type links on the homepage.
Can I export my charts?
Yes, you can export charts as PNG (for raster images) or SVG (for scalable vector graphics). Both formats are suitable for embedding in presentations, documents, or websites.
Is my data private?
Yes, your data stays in your browser. Make Graph does not store or access your information. The tool runs client-side, so your data never leaves your computer.


