AECharts is an advanced chart maker for business presentations that builds waterfall, Marimekko, Pareto, and other specialized charts from spreadsheets or AI prompts, exporting to PowerPoint, Google Slides, PNG, or MP4.
What is AECharts?
AECharts is a web-based tool designed to create professional business charts and diagrams that are difficult to produce in standard office software. It takes data from Excel, Google Sheets, or CSV files, or accepts natural language descriptions, and outputs fully customizable charts and diagrams. The platform is developed by the team at aecharts.com and is trusted by organizations like ByteDance and Intuit.
Key Features
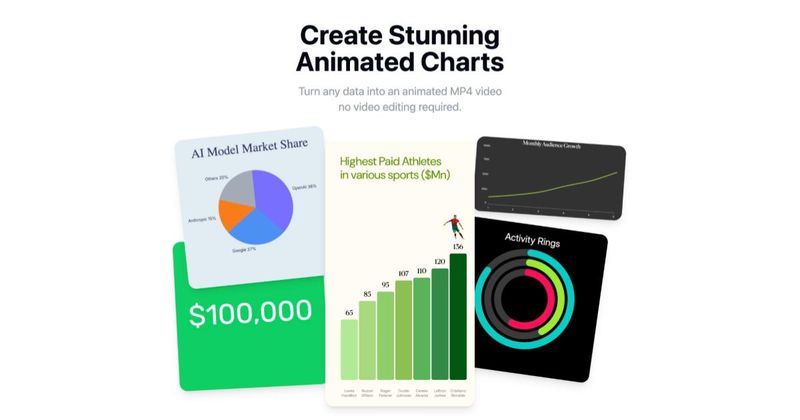
- Specialized business chart types — Supports over 20 chart types including waterfall, Pareto, Marimekko, funnel, dumbbell, radar, treemap, gauge, heatmap, pictograph, scatter, pie, donut, column, stacked column, grouped column, bar, stacked bar, grouped bar, bar race, line, multi-line, area, stacked area, line race, and animated number.
- AI prompt input — Describe the chart you want in natural language, and AECharts generates a first draft from your description.
- Spreadsheet integration — Import data from Excel, Google Sheets, or CSV files directly; also supports pasting data from spreadsheets.
- Full styling control — Customize fonts, colors, label formats, axis ranges, and every visual property. Team plans include a Brand Kit for consistent branding across all charts.
- Multiple export formats — Export to PowerPoint (PPTX), Google Slides, PNG, or MP4 video from the same source chart. Suitable for slides, reports, and video presentations.
- Smart presentation diagrams — Timeline, cycle, hub-and-spoke, and process flow diagrams that dynamically adjust as items are added or removed.
- Used by leading organizations — Trusted by teams at ByteDance, Intuit, The Epoch Times, University of Maryland, and Arizona State University.
Who is it for?
- Consultants building client presentations with complex charts like waterfall and Marimekko.
- Analysts and finance teams creating recurring reports with standardized charts and branding.
- Founders preparing investor updates with clear visualizations.
- Sales and marketing teams visualizing funnels, performance metrics, and campaign results.
What can you do with AECharts?
- Create advanced business charts — Generate waterfall, Pareto, Marimekko, and other specialized charts that are hard to build in Excel or PowerPoint.
- Animate charts for video — Export animated chart clips as MP4 for YouTube videos, webinars, social posts, and recorded presentations. Bars grow, lines draw, and pies sweep into place automatically.
- Maintain brand consistency — Use the Brand Kit to apply fonts, colors, and settings across all charts, ensuring a professional look in presentations.
How does AECharts work?
- Choose a business chart type from the gallery (waterfall, Pareto, funnel, etc.) or a presentation diagram.
- Add data by pasting from Excel, Google Sheets, or CSV, or describe the chart using an AI prompt to create a first draft.
- Customize styling — edit labels, colors, fonts, axes, and animation — then export to PowerPoint, Google Slides, PNG, or MP4.
FAQ
What chart types does AECharts support?
AECharts supports over 20 chart types including waterfall, Marimekko, Pareto, funnel, dumbbell, radar, treemap, gauge, heatmap, pictograph, scatter, pie, donut, column, stacked column, grouped column, bar, stacked bar, grouped bar, bar race, line, multi-line, area, stacked area, line race, and animated number. It also supports presentation diagrams like timeline, cycle, hub-and-spoke, and process flow.
Can I import data from spreadsheets?
Yes, you can paste data from Excel or Google Sheets directly into AECharts, or upload a CSV file.
What export formats are available?
AECharts exports charts to PowerPoint (PPTX), Google Slides, PNG image, and MP4 video. All exports come from the same source chart, ensuring consistency.
Is AECharts free to use?
Yes, AECharts offers a free plan. For team features like a Brand Kit, paid plans are available. See the website for pricing details.