
We track over 6,000 indie products in the Turbo0 directory, and every one of them has a public traffic snapshot from Similarweb attached to its listing. That gave us a rare chance to ask a boring but useful question: among indie tools that are actually growing right now, what do they have in common — category, pricing, backlink authority, or something else?
This is a data article, not a listicle. We are not claiming any of these 333 products is objectively "the best." We are reporting what a clean traffic snapshot says about who is winning right now, and trying to be honest about where the data is thin.
Methodology and what "high growth" actually means
Turbo0's indie pool starts at 5,960 alive listings (websites we've confirmed are not dead) with monthly visits capped at 5,000,000 — anything bigger, like ChatGPT or Google Fonts, is excluded so giants don't drown out indie signal. Of those 5,960, only 3,295 currently carry Similarweb visit-history data; growth can't be measured without a prior month to compare against, so that subset is our real denominator.
From those 3,295 measurable products, we filtered to:
- Monthly visits ≥ 5,000 (enough traffic that the growth number isn't statistical noise on a handful of visits)
- Month-over-month growth ≥ +20%
That left 333 products — about 10.1% of the measurable indie pool. This is the dataset behind every chart in this article. All traffic, growth, and Domain Rating (DR) figures are Similarweb/Ahrefs-style estimates from our early-August 2026 snapshot, not verified analytics from the product owners. Growth percentages on small bases can look dramatic — a jump from 900 to 7,800 visits is "+767%" and technically true, but it's a different phenomenon than a site holding steady at 300,000+ visits while adding another 90,000. We flag that distinction explicitly where it matters.
TL;DR on what we found:
- Growth concentrates in visual/creative and utility categories, but density (share of a category's total products that are growing fast) tells a different story than raw counts — Video Resources and Platforms have the highest hit rates, not the biggest headline numbers.
- Freemium dominates (52% of high-growth products), and pricing correlates with growth speed more than category does.
- Backlink authority (DR) barely matters once you're already growing — the correlation between DR and growth rate inside this group is essentially zero.
Where growth concentrates: category counts vs. category density
By raw count, growth is heavily weighted toward a handful of categories:
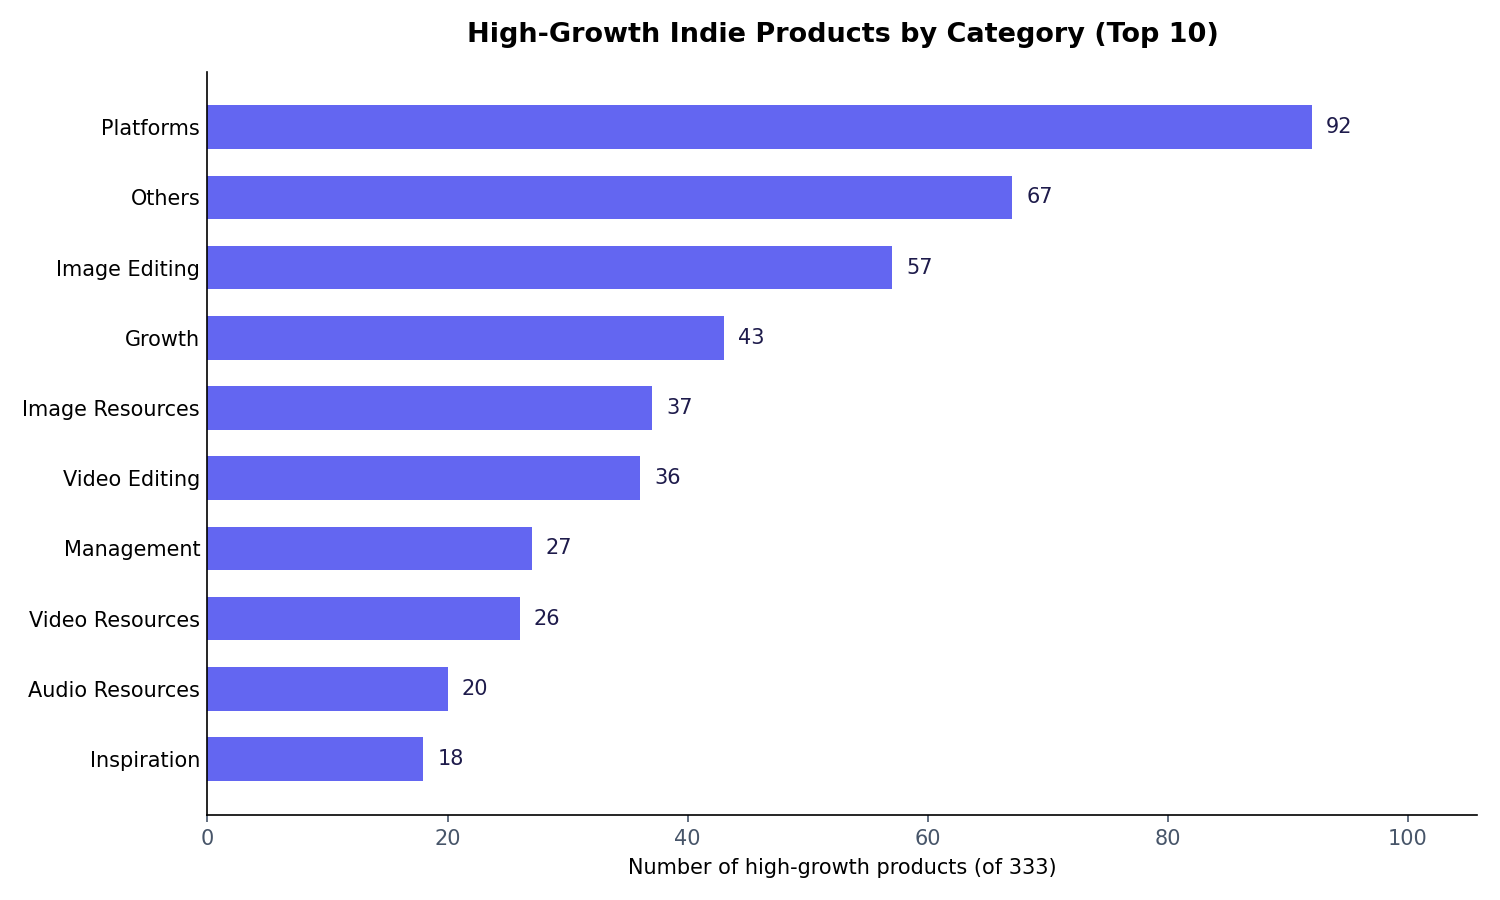 Absolute count of high-growth products per category tag (products can carry more than one tag, so totals exceed 333).
Platforms (92), Others (67), and Image Editing (57) lead by volume, which mostly reflects the fact that these are Turbo0's biggest categories overall — more listings means more chances to show up on a "fastest growing" list. Raw counts alone would tell you to go build "another AI platform," which isn't a useful takeaway.
A more honest lens is density: for each category, what share of all indie products in that category (not just the high-growth ones) are currently in our high-growth set? We could compute this for the ten categories where we have full indie-pool denominators from our pricing/category cross-tab:
| Category | High-growth count | Category pool size (indie) | Density |
|---|---|---|---|
| Video Resources | 26 | 346 | 7.5% |
| Platforms | 92 | 1,353 | 6.8% |
| Growth | 43 | 653 | 6.6% |
| Image Resources | 37 | 570 | 6.5% |
| Inspiration | 18 | 286 | 6.3% |
| Video Editing | 36 | 647 | 5.6% |
| Image Editing | 57 | 1,072 | 5.3% |
| Management | 27 | 629 | 4.3% |
| Others | 67 | 1,632 | 4.1% |
| Website Creation | 14 | 416 | 3.4% |
By density, Video Resources actually has the highest hit rate — 7.5% of everything tagged Video Resources in the indie pool is currently in fast-growth mode, edging out Platforms (6.8%) even though Platforms has 3.5x the absolute count. Website Creation and Others sit at the bottom, meaning they're large, crowded categories where a fast-growing product is comparatively rare. We don't have full-pool denominators for the smaller categories (Audio Resources, Note-taking, Copywriting, Typography, Audio Editing, Audio Recording, Font Resources, Screen Recording), so we're reporting those by absolute count only in the chart above rather than guessing at a density figure.
Practically: if you're deciding where to build, "biggest category" and "category where growth is most likely" are not the same list. Browse what's already live in each space via Turbo0's category directory before assuming a crowded category is automatically a bad one — density still leaves real headroom in Platforms and Growth-tools specifically.
Pricing: Freemium wins, but "Free" is close behind
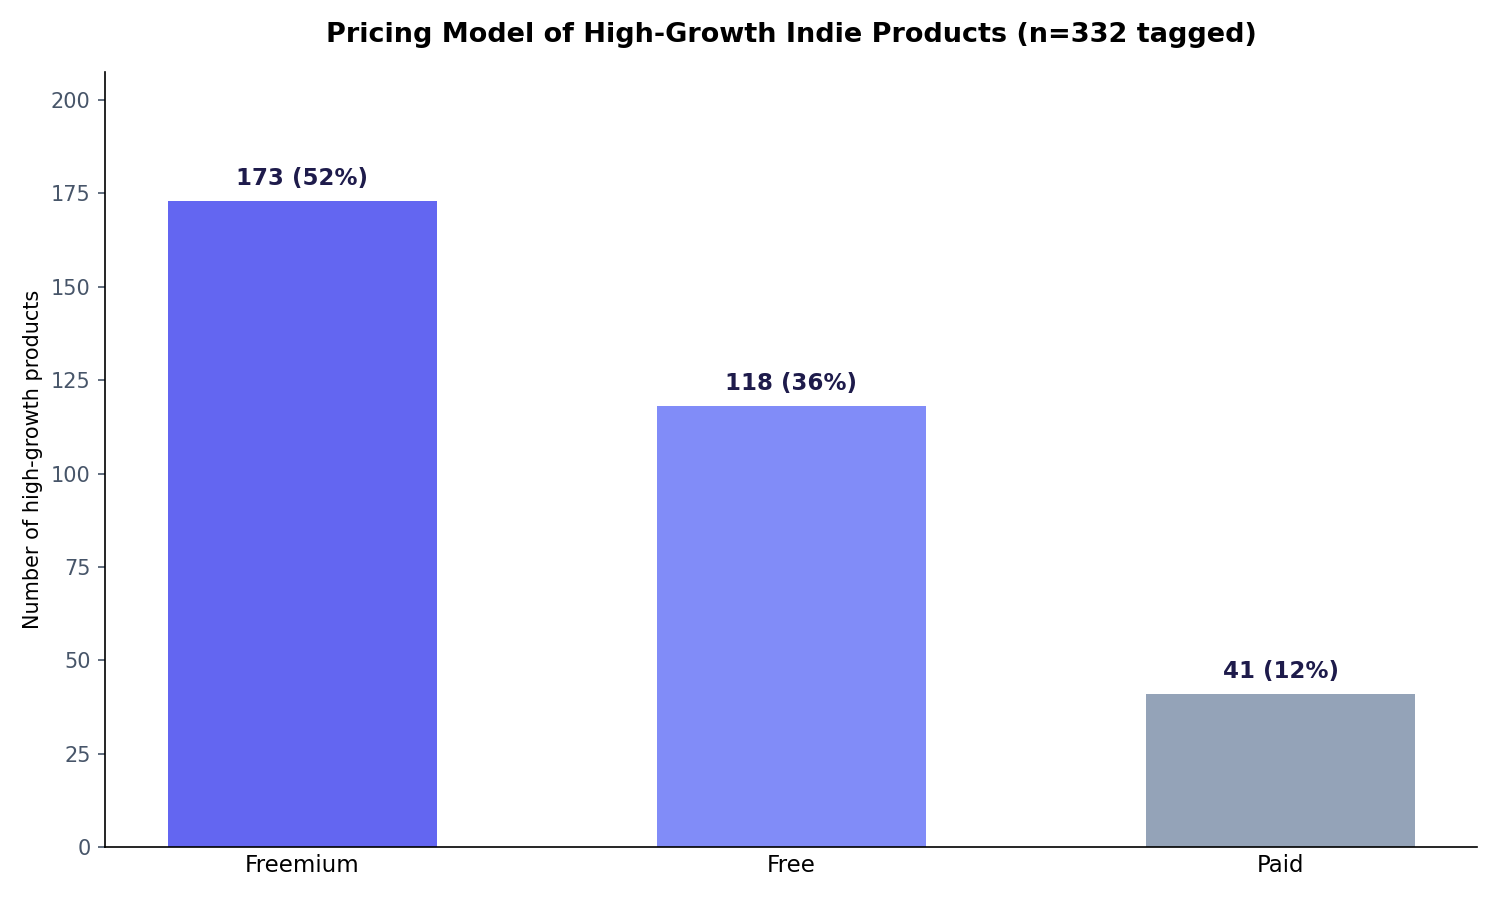 Distribution of the primary pricing tag across 332 tagged high-growth products (1 product had no matching price tag).
Freemium (173, 52%) is the dominant model among fast-growing products, followed by Free (118, 36%) and Paid (41, 12%). That's a meaningfully different mix from the indie pool at large, where our pricing dataset puts Paid products at a much larger relative share and shows materially lower median growth for Paid listings than for Free or Freemium ones. Read plainly: a no-friction first touch — try it free, decide whether to pay later — correlates with faster traffic growth than gating the product behind a paywall from day one. That doesn't mean paid products can't grow (41 of them are in this list), but they're underrepresented relative to their overall share of the directory, and the products that do grow while fully paid tend to be narrow, high-intent utilities rather than broad platforms.
Just how "high growth" is high growth?
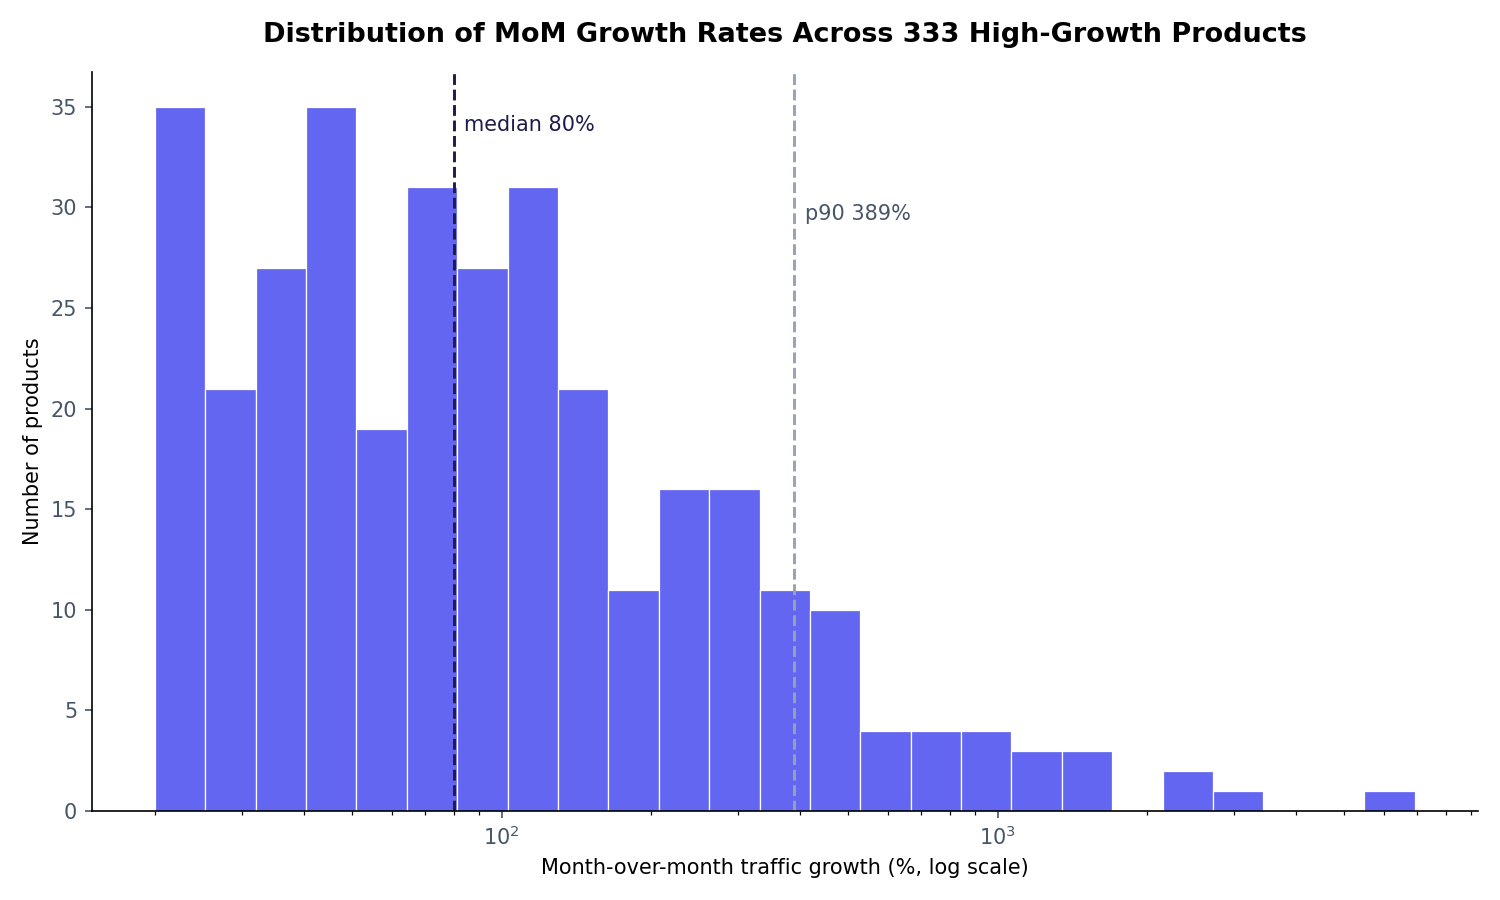 Log-scaled histogram of MoM growth percentage. Median 80%, p90 389%, max 6,597% (on a small base — see caveats).
The +20% floor is just the entry bar — the real distribution skews much higher. The median product in this set grew 80% month-over-month, and the top decile grew 389%+. A handful of extreme outliers (like FileShot.io, up from 2,529 to 169,359 monthly visits, or two watermark-removal utilities — chatgptwatermarkremover.org and removegeminiwatermark.net — both up 1,000%+) are riding narrow, high-intent search demand off a small starting base, on sites with single-digit-to-low-20s DR. These are real gains, but a different growth shape than an established product compounding off hundreds of thousands of existing visits — "1,000% growth" alone isn't proof of durable product-market fit; it can just as easily mean a landing page caught a trending keyword three weeks ago.
Does Domain Rating matter? Barely, once you're already growing
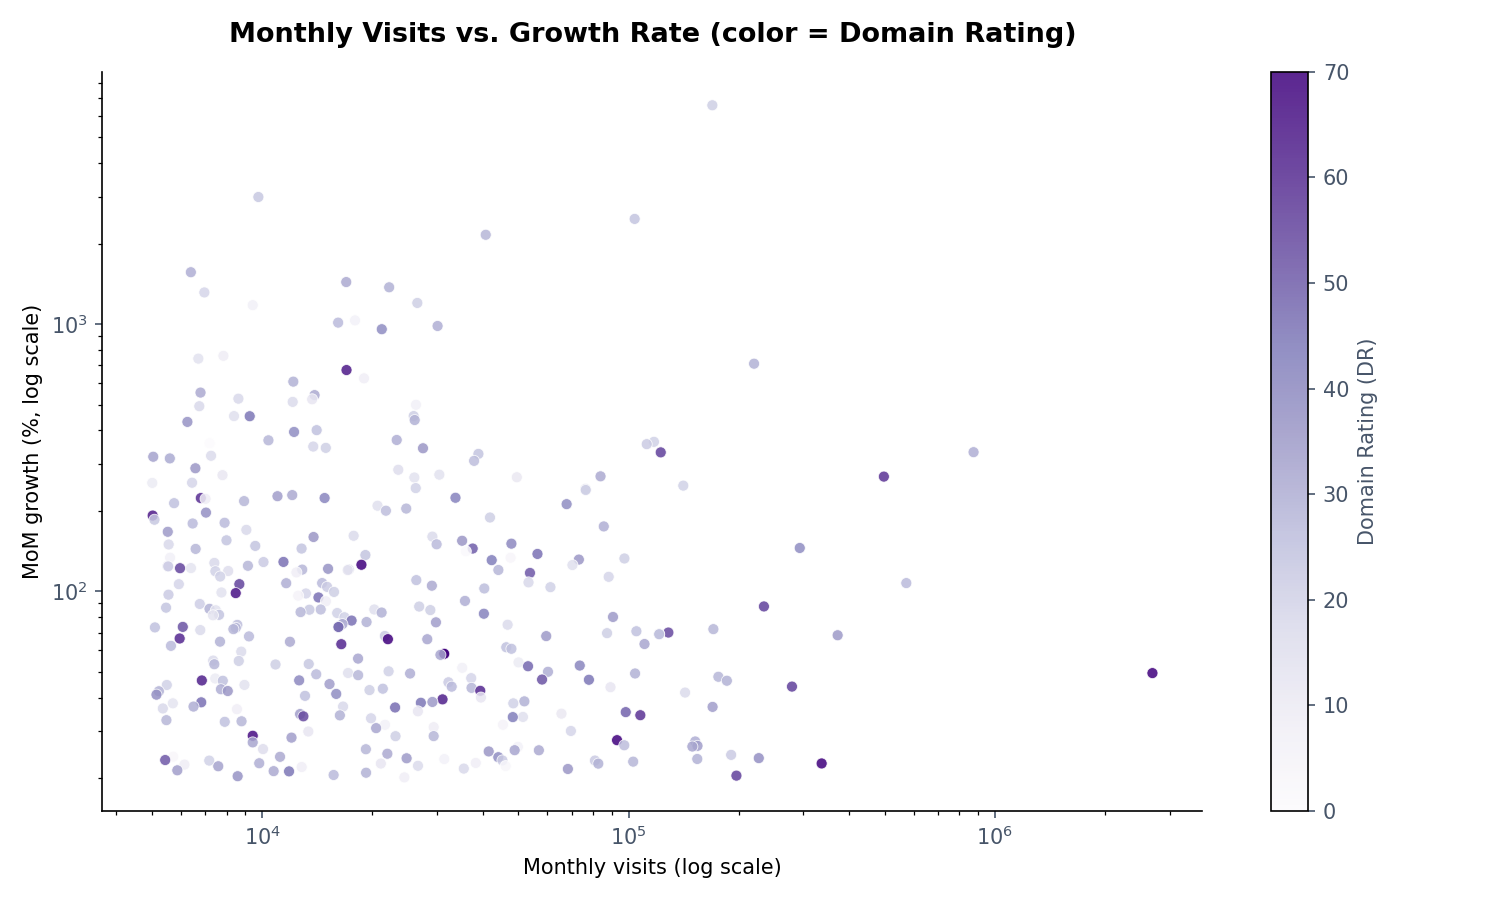 Each point is one high-growth product. Color encodes DR (darker = higher authority). Both axes are log-scaled.
This is the counterintuitive finding. The median DR across the 333 high-growth products is 27 (mean 28.5) — modestly higher than the roughly 18–20 median DR across the indie pool's pricing groups overall, so some baseline authority does seem to help a product clear the growth bar in the first place. But once a product is already in the high-growth set, DR stops predicting how much it grows: the correlation between DR and growth rate across these 333 products is -0.08, essentially flat. Fully 26% have DR below 20, and 62% have DR below 30 — including several of the fastest movers in the set, like Youth Job Board Canada (DR 9, +761%) and the watermark-remover utilities above (DR 6–7, +1,000%+).
The scatter plot makes this visible: the darkest (highest-DR) points are scattered across the full range of growth rates rather than clustering at the top. High authority correlates weakly with starting from a larger visits base (DR-to-log-visits correlation is +0.19, still fairly weak) more than it correlates with growth velocity. If you're an indie maker without years of backlinks, this dataset does not support "you need high DR to grow fast" as a blocker.
AI-assistant referral traffic: present, but still tiny
Of the 333 high-growth products, 28 (8.4%) show any measurable referral traffic from AI assistants (ChatGPT, Gemini, Claude, Perplexity, and similar) — a slightly higher incidence than the roughly 5.0% of the broader Similarweb-covered indie pool with any AI referral at all. But where it exists, the share is small: median 0.6% of total traffic, and even the top case in this group tops out at 2.6%. Across the wider directory, ChatGPT accounts for the large majority of AI-referral share when it appears at all (~65% average share among products with any AI referral), with Gemini, Claude, and Perplexity trailing well behind.
Read that as: AI-assistant discovery is a real, growing edge, not yet a primary channel, even for products actively winning traffic elsewhere. Worth instrumenting for and worth making your product genuinely citable (clear docs, structured comparisons, a crawlable changelog), but not worth over-indexing your whole growth strategy on today.
On traffic sources more broadly, we have to flag a real limitation in our source data: Similarweb's search, social, and paid-referral share fields return exactly zero for every single product in our entire database, which is almost certainly an upstream data-tier limitation rather than a claim that no Turbo0 product gets organic search or social traffic. We can only speak confidently to direct, referral-link, and email traffic. Within products where a channel is identifiable, direct traffic dominates (average ~13.5% of measured share among high-growth products), referral links are a distant second (~2.7%), and email is negligible (~0.4%). We're not going to claim "SEO doesn't matter for indie growth" from this data — that conclusion isn't supported, it's a gap in what we can observe.
Three products, three growth shapes
To make the statistics concrete, three real listings from this dataset:
- CrePal (Video Editing / Video Resources / Platforms, DR 35) grew from roughly 221,000 to 372,000 monthly visits (+68%) — a large, established product compounding off an already-substantial base. This is the "boring good" growth shape: steady expansion on top of real scale.
 CrePal's homepage — an established, multi-category product with real scale behind its +68% growth.
- Nano Banana Pro (Image Editing, DR 31) roughly quadrupled from 22,700 to 83,900 monthly visits (+269%) — mid-stage momentum, riding the broader wave of interest in AI image editing without yet being a top-tier authority site.
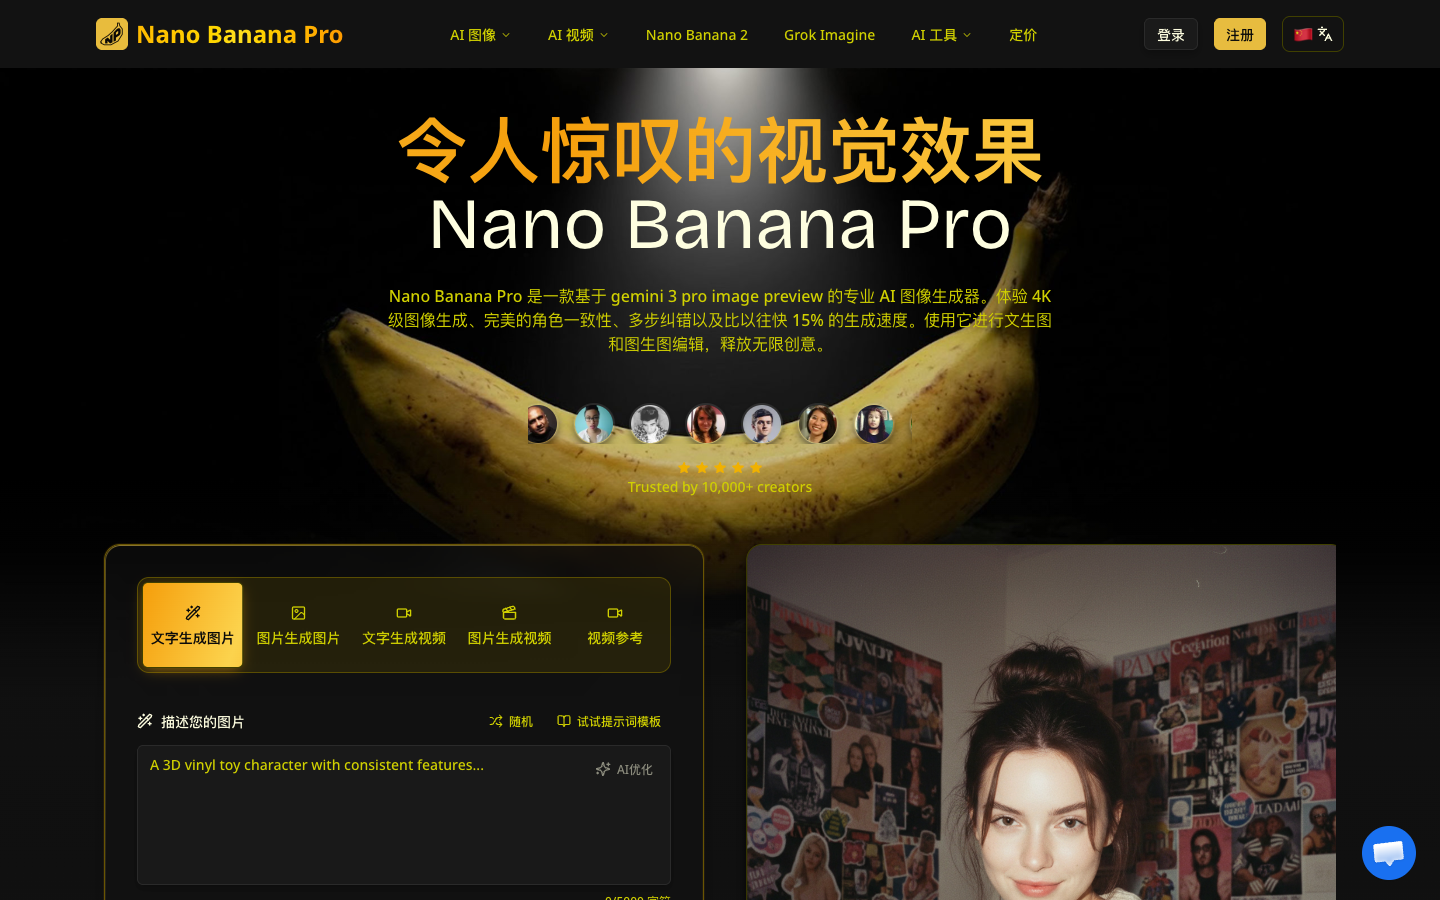 Nano Banana Pro's homepage — riding the broader AI-image-editing wave, mid-stage authority but momentum well above its DR would suggest.
- Gemini Watermark Remover (Image Editing, DR 6) jumped from 1,583 to 17,932 monthly visits (+1,033%) on almost no backlink authority — a narrow, single-feature tool capturing demand for one very specific, high-intent search query.
 A Gemini watermark-remover landing page — the archetype of a single-feature tool riding one narrow, high-intent search query to a 1,000%+ growth spike on almost no backlink authority.
Same "high growth" label, three genuinely different businesses. We'd treat them as different playbooks, not one recipe.
What this means for indie makers (and for us)
A few concrete, data-backed takeaways:
- Ship the free tier first. Freemium and Free together are 88% of this list. If your model is fully paid from launch, expect a steeper climb to visible traffic growth — plan for it rather than being surprised by it.
- Don't let DR anxiety stop you from launching. A quarter of the fastest-growing products in our directory have DR under 20. Authority may help you clear the growth bar eventually, but it does not predict how fast you'll grow once you're moving.
- Density beats raw category size when picking a niche. Video Resources and Platforms had the best hit rates in our data, not the biggest headline counts — check both before you commit to a category.
- Treat huge percentage growth numbers skeptically, including your own. A jump from a few hundred visits to a few thousand is real, but it's not evidence of durable demand yet. Watch whether growth holds for two or three months in a row, not one snapshot.
- Instrument for AI-assistant referrals now, even though the volume is small today. 8.4% of high-growth products already show measurable ChatGPT/Gemini/Claude/Perplexity referral traffic; that share was likely near zero a year ago and is probably not shrinking.
- Get listed somewhere your traffic snapshot can actually be tracked. We only have Similarweb history for 3,295 of 5,960 indie products, which means over 2,600 listings have no visible growth story at all — including possibly-growing ones. If you're not already indexed, submit your product to Turbo0 so there's a public trail to point to next time someone runs this analysis.
Data notes and limitations
All traffic, growth, and DR figures are third-party estimates (Similarweb-style traffic, Ahrefs-style Domain Rating) captured for this article on August 9, 2026 — not first-party analytics from the product owners, and not immune to smoothing or lag in ways we can't fully audit. The 333-product set is only the subset of the indie pool that had visit-history data available and cleared our +20% MoM / 5,000-visit thresholds; roughly 2,665 indie products had no comparable Similarweb history and are excluded by construction, not because they aren't growing. Search, social, and paid-referral traffic-source shares are structurally empty in our data source for every product in the database and should not be read as evidence about actual search or social performance. We'll revisit this analysis periodically as more listings accumulate traffic history.