
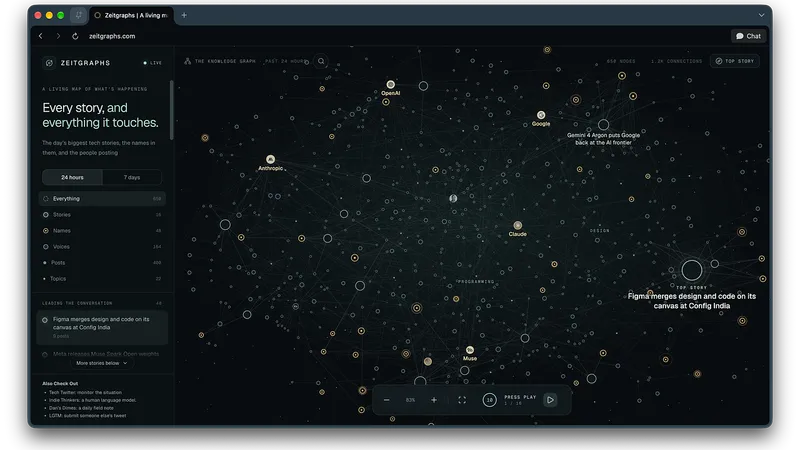
Zeitgraphs: Live Knowledge Graph of Tech Discourse on X
Zeitgraphs transforms how you discover and understand the tech industry's most important conversations. Rather than drowning in an endless social media feed, Zeitgraphs visualizes the entire landscape of tech discourse as an interactive knowledge graph that updates throughout the day. Every story, post, person, company, and AI model becomes a distinct node, with connecting lines revealing exactly who's talking about what and how different topics relate to one another.
The platform addresses a fundamental problem for anyone keeping pace with technology: information overload. While X (formerly Twitter) captures breaking news and emerging trends in real-time, the sheer volume of posts makes it nearly impossible to separate signal from noise. Zeitgraphs solves this by automatically mapping conversations across the platform, then surfacing the day's most significant tech stories through visual relationship mapping rather than chronological feeds or algorithmic rankings.
When you open Zeitgraphs, you immediately see a complete snapshot of tech discourse from the last 24 hours or the past 7 days, depending on your preference. The interface presents this data as an interactive graph where node size and positioning reflect importance—the biggest stories literally rise to the top, making it instantly clear what the tech community considers most significant. This visual hierarchy eliminates guesswork and lets you prioritize your attention where it matters most.
The platform includes an innovative guided tour feature called "play." Press play and Zeitgraphs walks you through each top story in sequential order, automatically zooming into relevant posts and highlighting the key people driving the conversation. This transforms passive browsing into an active learning experience, presenting information in a structured narrative format rather than requiring you to piece together context from scattered posts.
Exploration is intuitive and deep. Click any node in the graph—whether it's a story, person, company, or AI model—and you instantly see its full network of connections. The interface displays related posts, shows which other entities are connected to that node, and provides context for how this element fits into the broader tech landscape. This relationship-focused design reveals patterns and connections you'd never discover scrolling through a traditional feed.
For deeper investigation, each node links to a full story page containing every cited post, complete citations, and the full context of how that story developed throughout the day. This comprehensive view helps you understand not just what happened, but how the narrative evolved, who contributed to the conversation first, and which insights drove the most engagement and discussion.
The data refreshes continuously throughout the day, ensuring that Zeitgraphs always reflects current discourse. This means you can check in at any time and instantly see what's newly trending in tech, what established stories have developed further, and which emerging topics are starting to gain traction among industry leaders and influencers.
Zeitgraphs is completely free to use, making professional-grade tech intelligence accessible to everyone from casual followers to industry professionals. Whether you're a software engineer, product manager, startup founder, investor, journalist, or simply someone who wants to stay informed about technology's direction without spending hours on social media, Zeitgraphs delivers the essential information you need in a fraction of the time.
The platform's focus on X (the primary platform for tech industry discourse) means you're seeing conversations from the people actually making decisions in technology: founders, engineers, investors, researchers, and thought leaders. These conversations often break news and surface important developments hours or days before mainstream tech media coverage.
By


