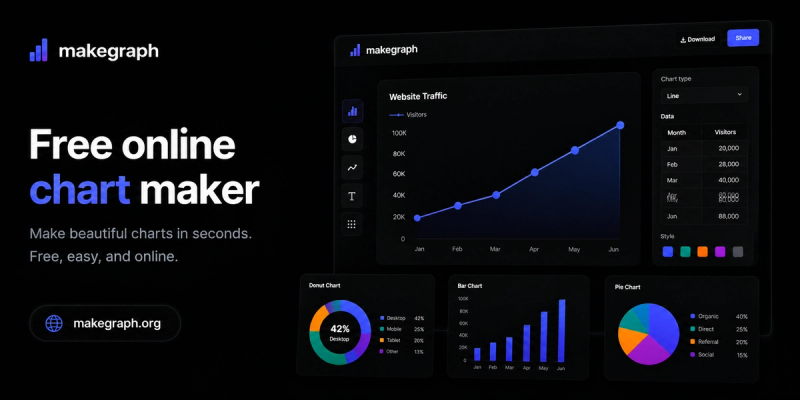
MakeGraph is a free online chart maker that converts spreadsheet data (Excel or CSV) into professional charts, including bar, line, pie, radar, and over 20 other chart types, with instant PNG/SVG export and no signup required.
What is MakeGraph?
MakeGraph is a web-based chart generator that accepts Excel or CSV data as input and produces customizable charts as output. Users can upload files or paste tabular data, select from a wide variety of chart types, and export the result as PNG or SVG without any registration. The tool is fully free with no signup required.
Key Features
- Instant chart generation — Upload or paste your data, and the chart renders within seconds.
- Over 20 chart types — Including bar, line, pie, radar, scatter, area, confidence interval, correlation matrix, Marimekko, tree map, sunburst, bar chart race, double bar, stacked bar, waterfall, negative bar, population pyramid, and band seating chart.
- Customization — Edit labels, colors, and chart styles directly in the interface.
- Export PNG and SVG — Download static images or scalable vector graphics for high-quality reports and presentations.
- No signup or registration — Fully free with no account required.
- Data flexibility — Supports Excel (.xlsx, .csv) files and pasted data.
Who is it for?
- Business professionals — Quickly visualize quarterly sales data or performance metrics from CSV exports.
- Students and academics — Create charts for research papers, presentations, and class projects without learning complex software.
- Data analysts — Generate exploratory charts from raw data to identify trends and outliers before deeper analysis.
- Content creators — Produce clean, branded charts for blog posts, social media, and infographics.
What can you do with MakeGraph?
- Analyze survey results — Upload a CSV of survey responses and generate a stacked bar chart to compare demographic segments.
- Track performance over time — Use the line chart to plot monthly revenue or website traffic with customizable date labels.
- Create animated bar chart races — Choose the bar chart race maker to animate ranking changes over time for dynamic presentations.
- Design seating plans — Use the band seating chart tool to arrange orchestra or band members in a semicircle layout for rehearsal.
How does it work?
- Upload or paste your data into the editor.
- Choose a chart type from the gallery.
- Customize labels, colors, and other settings.
- Preview the chart instantly.
- Export as PNG or SVG.
FAQ
Is MakeGraph free?
Yes, MakeGraph is completely free to use with no signup required. There are no hidden fees or watermarks.
MakeGraph accepts Excel (.xlsx, .csv) and CSV files. You can also paste tabular data directly into the editor.
Yes, you can export your charts as SVG (scalable vector graphics) for high-quality prints and further editing.
How many chart types are available?
MakeGraph offers over 20 chart types, including bar, line, pie, radar, scatter, area, confidence interval, correlation matrix, Marimekko, tree map, sunburst, bar chart race, double bar, stacked bar, waterfall, negative bar, population pyramid, and seating chart.