
"Should this be free, freemium, or paid?" is one of the first questions every indie maker asks, and usually the answer is a guess dressed up as a strategy. We track over 6,000 indie products in the Turbo0 directory, and almost 5,900 of them carry a normalized pricing tag — Free, Freemium, or Paid — alongside a Similarweb traffic snapshot. That combination let us ask a more grounded version of the question: across thousands of real listings, which pricing model actually correlates with traffic, and which one is quietly underperforming its reputation?
The headline finding surprised us more than we expected: the pricing model with the highest mean traffic is also the one with the worst typical outcome and the slowest typical growth. That's not a contradiction — it's a statistics lesson hiding inside a business decision, and it's the center of this article.
Methodology: what we counted and what we didn't
Every dataset here comes from Turbo0's indie pool — 5,960 alive listings (confirmed not dead) with monthly visits capped at 5,000,000, so category giants don't drown out indie signal. Pricing tags are normalized (lowercased, alphanumeric-only) and matched against free, freemium, and paid; a listing without a matching tag falls into a small "unlabeled" bucket (85 products) that we exclude from the core comparison because its sample is too thin to trust.
That leaves three groups:
| Pricing model | Listings | With visits data | Median visits | Mean visits | Median growth (MoM) | High-growth share | Median DR |
|---|---|---|---|---|---|---|---|
| Free | 2,123 | 1,151 (54%) | 564 | 28,743 | 10.64% | 10.25% | 18 |
| Freemium | 2,811 | 1,640 (58%) | 348.5 | 33,067 | 15.32% | 10.55% | 20 |
| Paid | 941 | 497 (53%) | 434 | 66,295 | 2.92% | 8.25% | 19 |
"High-growth share" is the percentage of a group's listings that clear our high-growth bar (≥5,000 monthly visits and ≥20% month-over-month growth). All traffic and growth figures are Similarweb-style estimates from our early-August 2026 snapshot — not first-party analytics — and only the ~54–58% of each group that currently has visit history is represented in the visits/growth numbers. We'll come back to those caveats at the end.
TL;DR on what the data shows:
- Paid's headline traffic number is an illusion. A handful of massive outliers inflate the mean 153x above what a typical Paid product actually sees — and the typical Paid product is barely growing.
- Freemium is the healthiest model for growth, full stop — highest median growth rate, highest high-growth share, and no need for outlier apologetics.
- The right pricing model depends heavily on category — Growth and Management tools lean Paid; Image Editing and Inspiration lean Freemium and Free.
The number that matters most: Paid's 153x mean-to-median gap
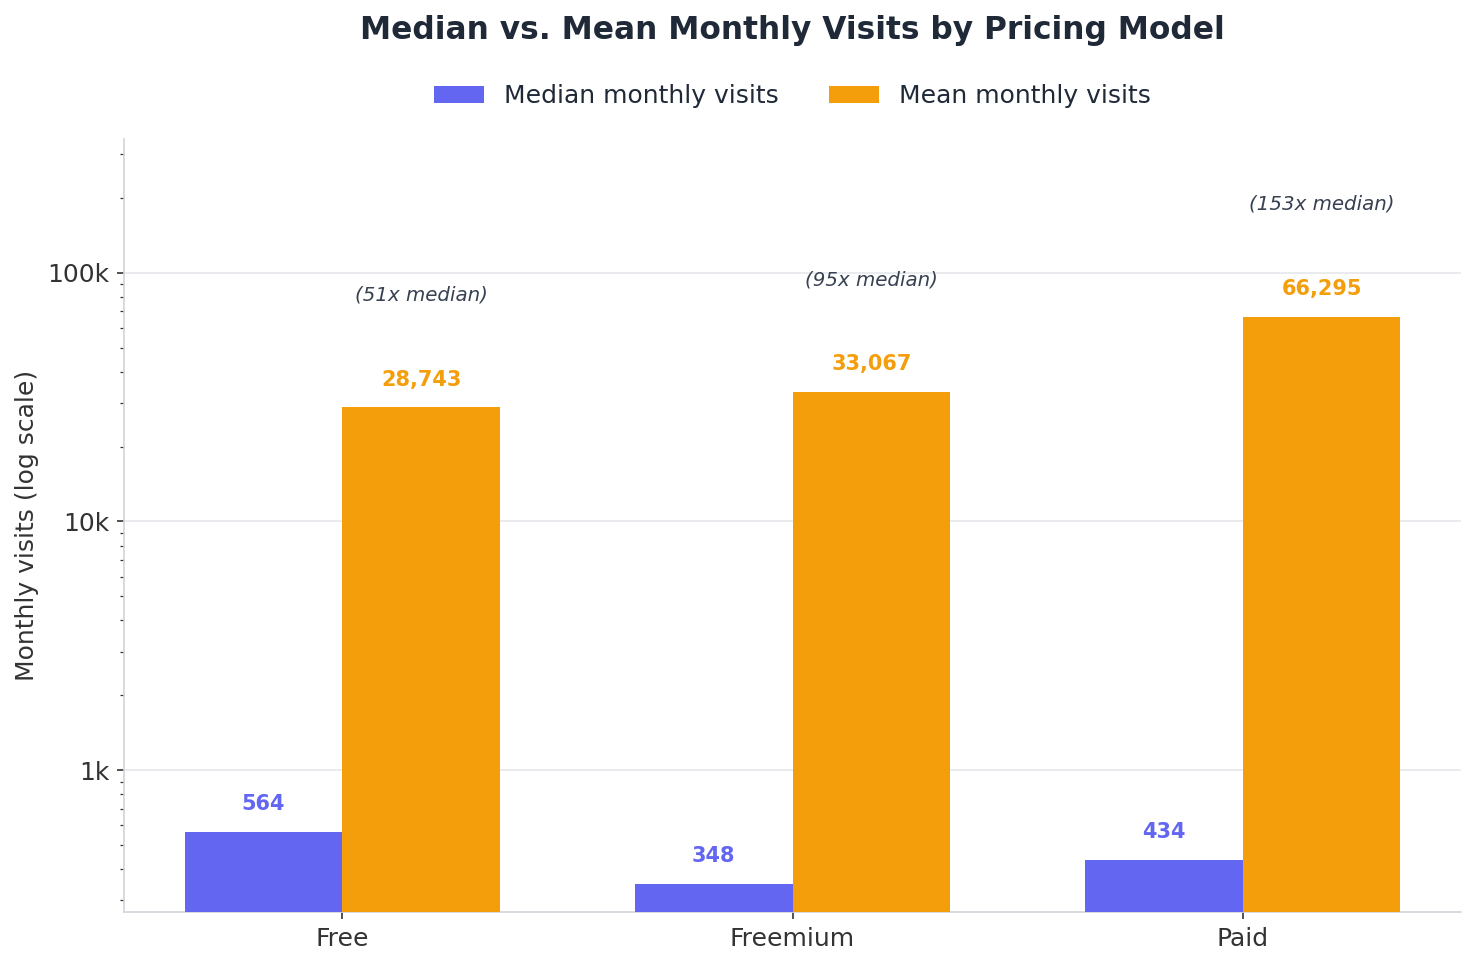 Median vs. mean monthly visits per pricing group. The gap between the two bars shows how much outliers are inflating the "average" figure.
Look at the median column first, because it's the number that describes what actually happens to most products. A typical Free tool gets 564 monthly visits. A typical Freemium tool gets 348.5. A typical Paid tool gets 434 — right in between, nothing special.
Now look at the mean. Free's mean (28,743) is about 51x its median. Freemium's mean (33,067) is about 95x its median. Paid's mean (66,295) is a staggering 153x its median.
This is the classic mean-vs-median trap, and it's worth spelling out because it's the most misleading number in pricing conversations. Imagine ten friends in a coffee shop, each earning a normal salary — call it a "median" income. Now Jeff Bezos walks in. The mean income of everyone in that coffee shop just became a nine-figure number, even though nobody's actual paycheck changed. The mean got hijacked by one extreme value; the median didn't move, because it just describes whoever is in the middle.
That's exactly what's happening inside the Paid group. A small number of paid products — likely established SaaS tools that have scaled into six- or seven-figure monthly traffic while staying under our 5-million-visit indie-pool cap — are pulling the mean far above what a normal paid indie product experiences. Strip out the handful of scaled winners, and the typical paid listing looks a lot like a typical free one, just with a paywall in front of it.
We call this the boutique trap: if you launch paid, you are betting on becoming one of the rare outliers that pulls the mean, because the median outcome for Paid products is unremarkable traffic and — as the next section shows — unremarkable growth.
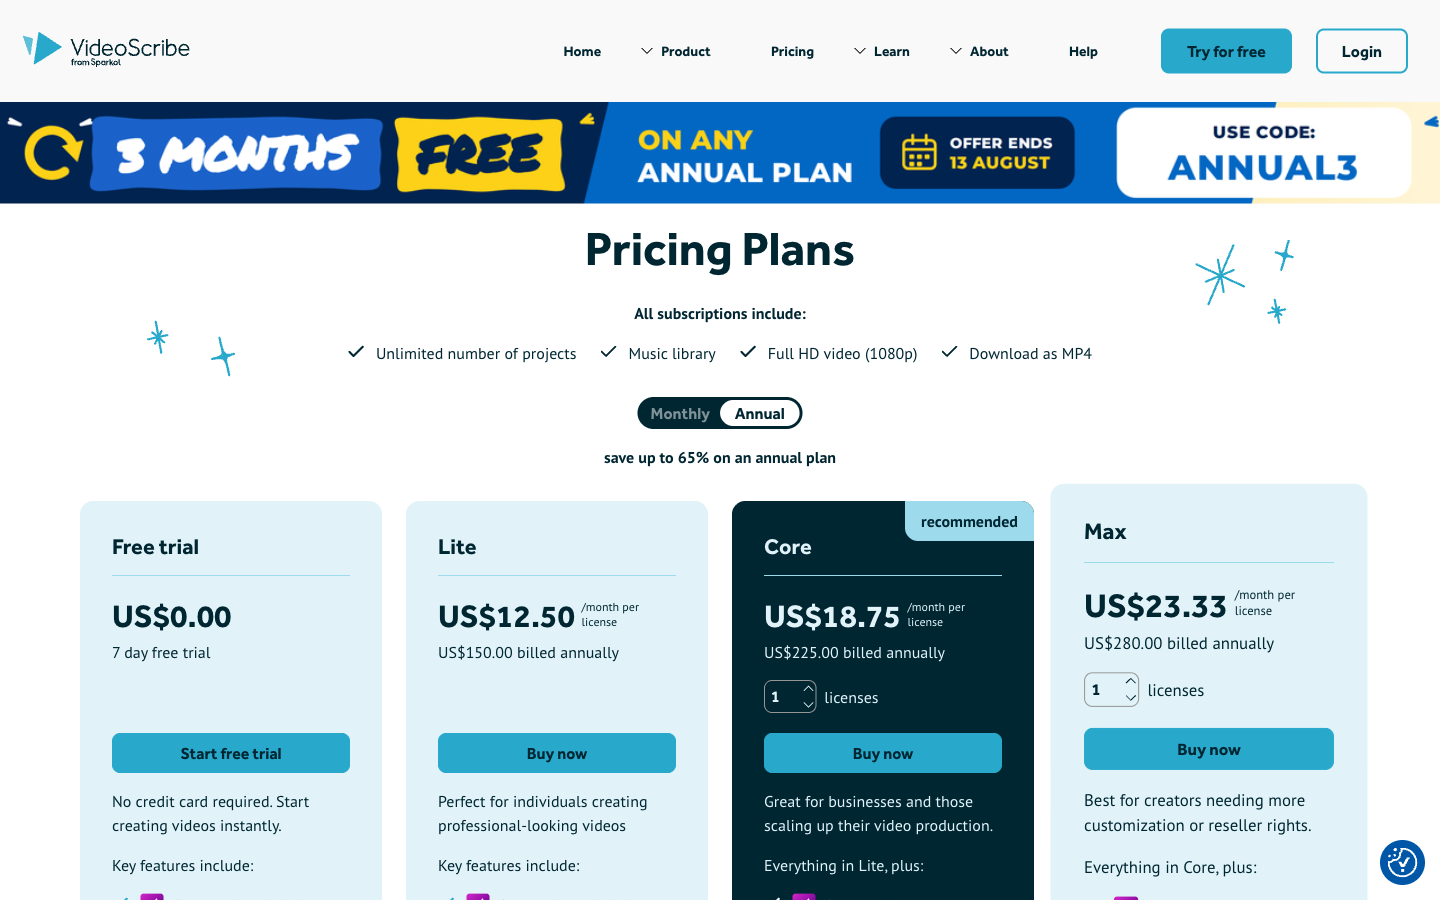 A representative Paid pricing page (not one of the named outliers above) — a time-limited free trial gating into fixed monthly tiers, the structure most Paid indie tools share.
Paid products aren't just smaller, they're growing slower too
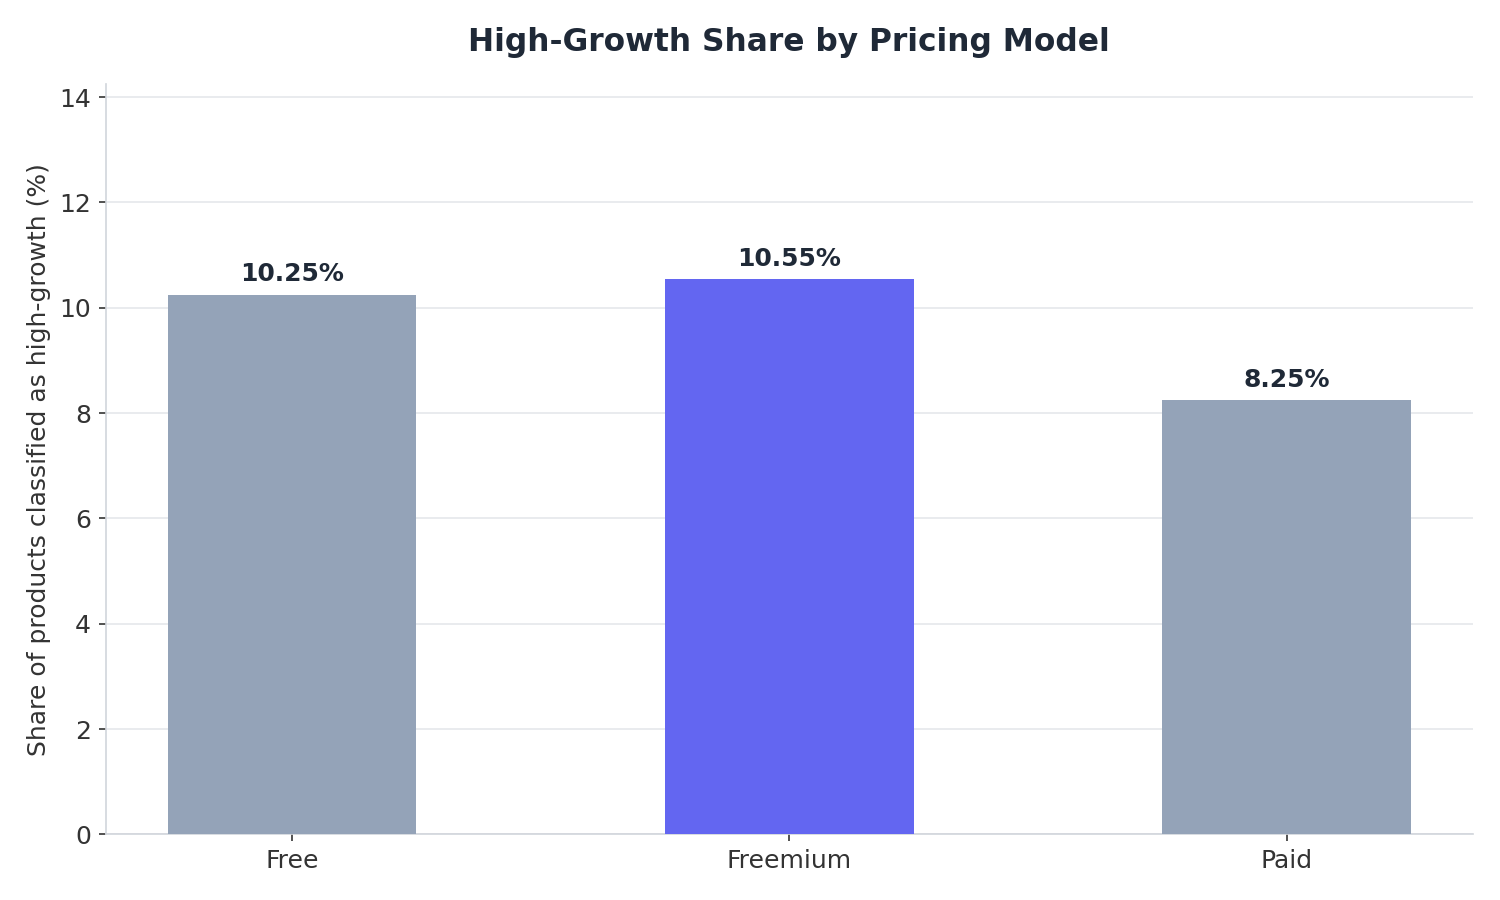 Share of each pricing group's listings that qualify as high-growth (≥5,000 monthly visits and ≥20% MoM growth).
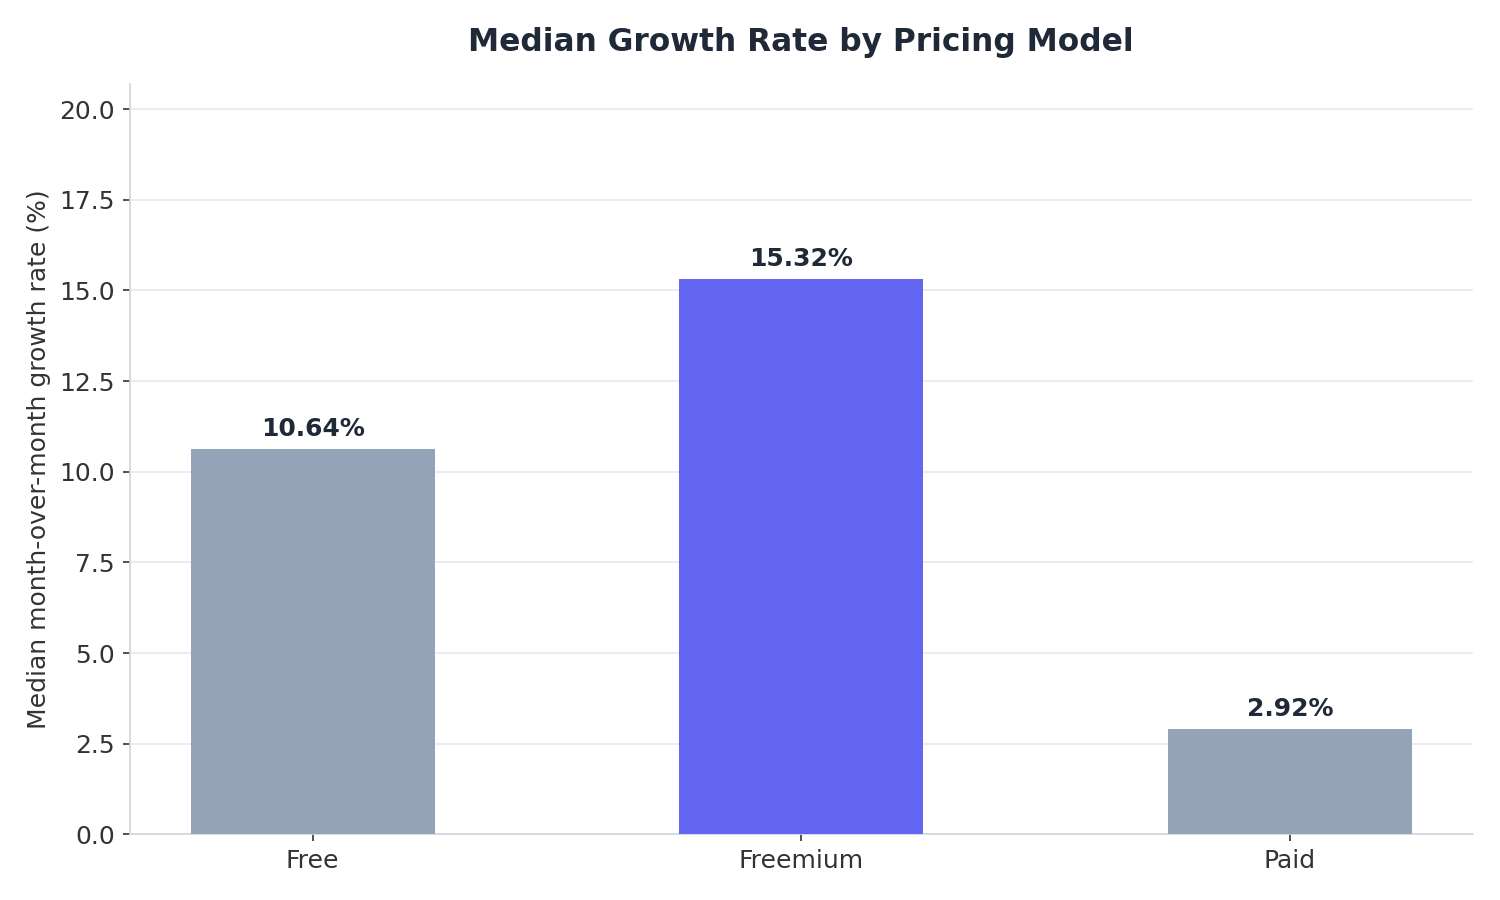 Median month-over-month traffic growth rate by pricing group.
If Paid's low median visits were paired with strong growth, you could argue it's simply an earlier-stage cohort that will catch up. The data doesn't support that story. Paid products have the lowest median growth rate (2.92%) of the three groups — roughly a fifth of Freemium's — and the lowest high-growth share (8.25%), meaning a smaller fraction of paid products are breaking out at all.
Freemium, by contrast, posts the best numbers on both axes: 15.32% median growth, more than double Free's and over 5x Paid's, and the highest high-growth share (10.55%). Free sits in between on growth (10.64%) but is close to Freemium on high-growth share (10.25%) — consistent with a "free gets you discovered" dynamic even without a monetization layer attached.
 A representative Freemium pricing page (not one of the named outliers above) — a genuine free-forever tier sitting next to paid tiers, the low-friction entry point that correlates with Freemium's stronger growth numbers.
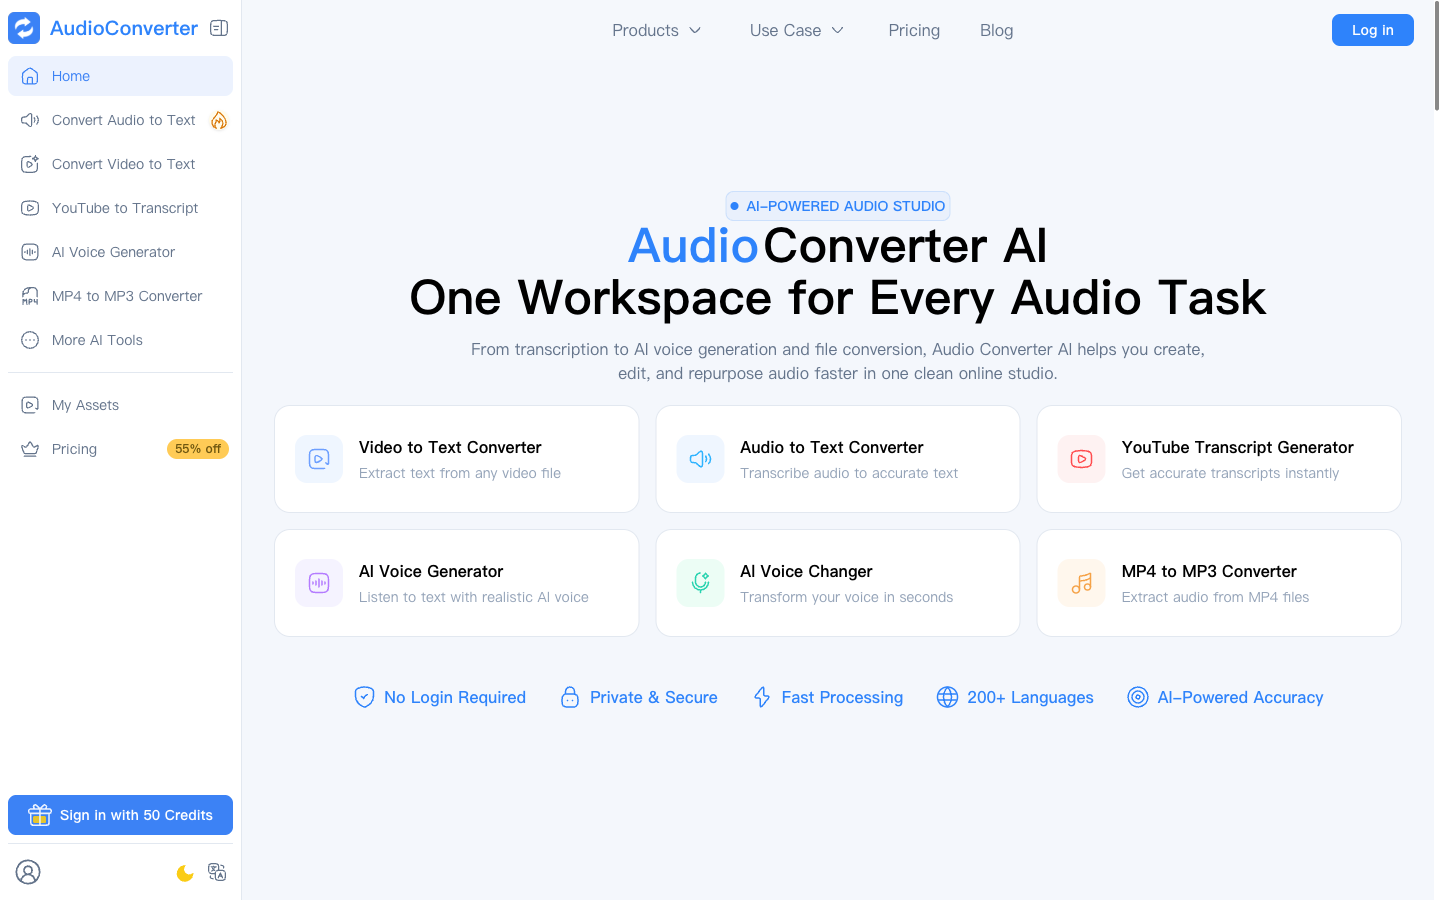 A representative Free-tier homepage — no paywall in front of the core tools, the kind of no-friction entry point behind Free's strong high-growth share.
Put simply: Freemium is the only model here where the median product is meaningfully growing. Free gets people in the door. Paid, for a typical product without an existing brand or scaled distribution, mostly just sits there.
None of this means "never charge money." It means a hard paywall from day one removes the low-friction discovery loop that drives the other two models' growth — and unless you already have the audience, authority, or virality to be one of the outliers pulling that 153x mean, you should expect a slower traffic climb, not a faster one, from going Paid first.
Domain authority isn't the differentiator
One thing that doesn't explain the gap: backlink authority. Median Domain Rating is nearly flat across all three groups — 18 (Free), 20 (Freemium), 19 (Paid). If Paid products were simply younger or less-linked sites, we'd expect a materially lower DR; instead the groups are within two points of each other. Whatever separates Paid's weak median outcome from Freemium's strong one, it isn't a backlink deficit — it's the pricing wall changing who tries the product and how easily it spreads.
Which categories actually suit which pricing model
Pricing isn't chosen in a vacuum — it should match what the category's buyers expect. We cross-tabbed pricing tags against Turbo0's ten largest categories:
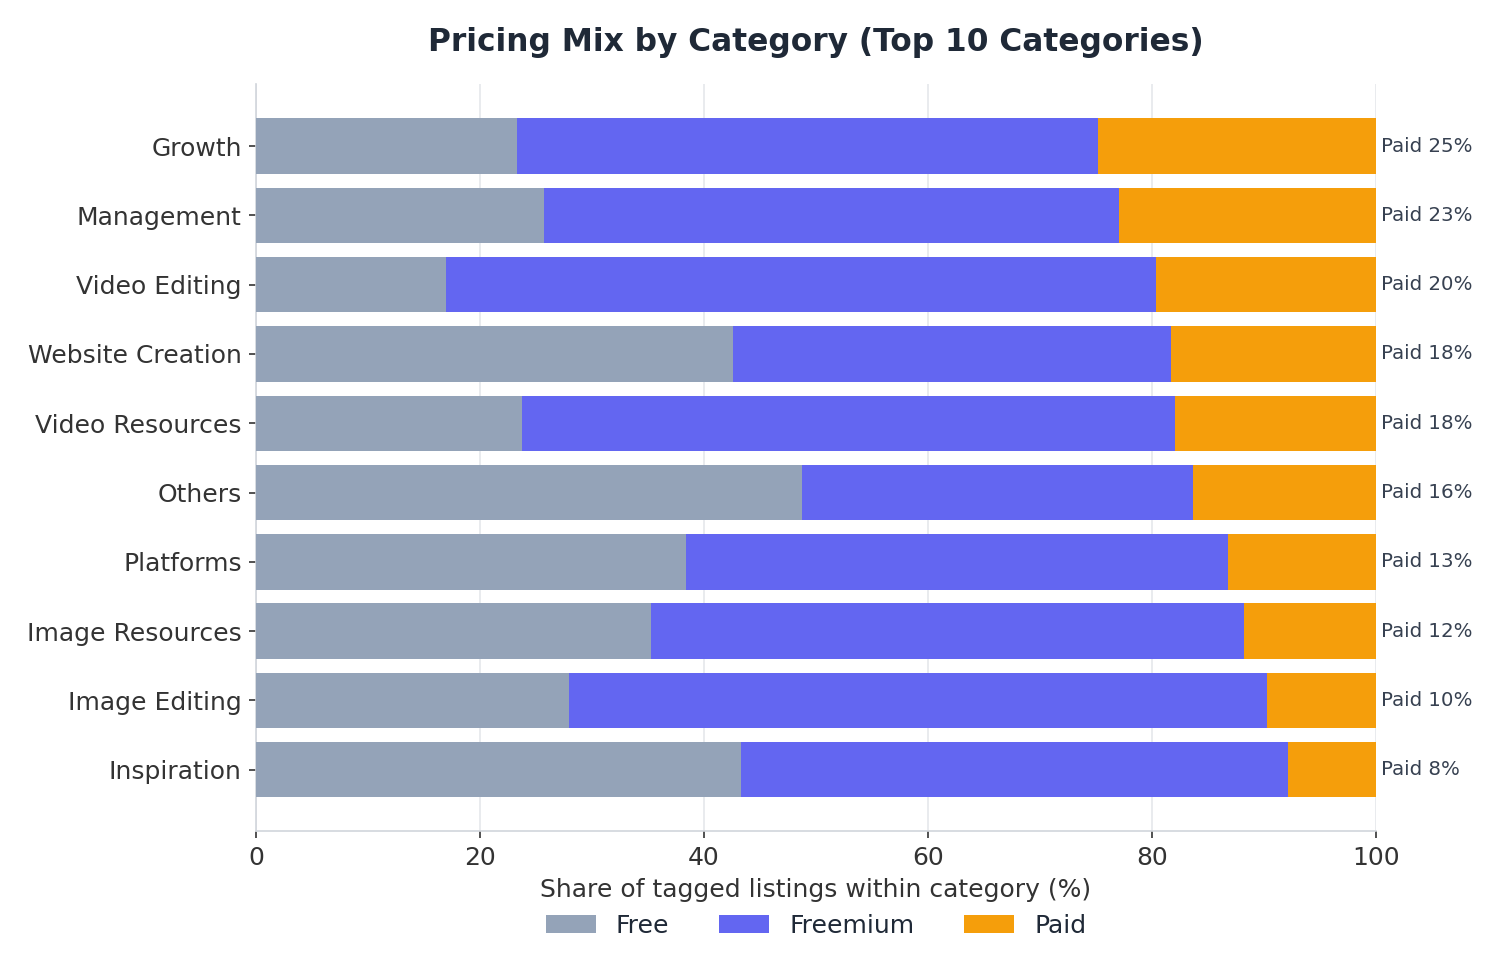 Share of Free / Freemium / Paid listings within each of the ten largest categories, sorted by Paid share (highest first).
| Category | Free | Freemium | Paid |
|---|---|---|---|
| Growth | 23.1% | 51.6% | 24.7% |
| Management | 25.4% | 50.9% | 22.7% |
| Video Editing | 16.7% | 62.4% | 19.3% |
| Website Creation | 42.1% | 38.7% | 18.0% |
| Video Resources | 23.4% | 57.5% | 17.6% |
| Others | 48.0% | 34.4% | 16.1% |
| Platforms | 38.1% | 48.0% | 13.1% |
| Image Resources | 34.6% | 51.9% | 11.6% |
| Image Editing | 27.2% | 60.9% | 9.5% |
| Inspiration | 42.7% | 48.3% | 7.7% |
Two patterns jump out:
- Growth and Management tools tolerate paywalls best. These are B2B-flavored categories (marketing tools, project/team management) where buyers are used to recurring software spend and evaluate on ROI rather than needing a free trial to feel confident. Paid share here (22.7–24.7%) is roughly 2–3x the Paid share in Inspiration or Image Editing.
- Visual and creative tools cluster hard around Freemium. Image Editing (60.9% Freemium) and Video Editing (62.4% Freemium) are the two most Freemium-heavy categories on Turbo0. These are inherently "try it on my own file first" products — a static screenshot or feature list doesn't sell a filter or an editing effect the way actually using it does.
- Inspiration and Website Creation lean Free. Inspiration (42.7% Free) is mostly content/reference-driven, where charging up front makes little sense before you've built an audience. Website Creation (42.1% Free) likely reflects a lot of free-tier builders and generators competing for top-of-funnel users before upselling hosting or export.
If you already know your category, this table is a reasonable prior for what your market expects — and you can sanity-check any specific competitor's approach by browsing Turbo0's category pages and filtering by pricing tag directly on listings.
If we launched a product today, how would we price it?
Pulling the findings above into an actual decision framework:
- Default to Freemium unless you have a specific reason not to. It has the best median growth and the best high-growth share in our entire dataset. It's the closest thing to a statistically safe default among the three models.
- Don't launch Paid-only unless you already have distribution. The data says a fully paid launch, absent an existing audience, historic SEO, or a viral wedge, tends to land you at the unremarkable median (434 visits, 2.92% growth) rather than the outlier tail that's pulling Paid's mean up.
- In B2B/ops categories (Growth, Management), Paid is a legitimate first move. These buyers pay for software by default; a generous free tier may cost you conversion signal without buying you much extra reach.
- In visual/creative categories (Image Editing, Video Editing), let people touch the output before you ask for money. A free or freemium tier that lets someone process their own file is close to mandatory competitive table stakes in these categories — 60%+ of listings already do this.
- If your category is closer to Inspiration or content-led discovery, start Free and monetize later. Charging up front before you've proven the content/utility loop works tends to suppress the organic spread that content-first products depend on.
- Whatever you pick, get it measured. Only about half of each pricing group in our dataset has visit-history data at all — meaning roughly 45–47% of listings have no visible growth trajectory to point to, paid or not. If your product isn't tracked anywhere, you can't tell later whether your pricing call was actually the reason for slow growth. Submit your product to Turbo0 so there's a public trail on this the next time someone runs an analysis like this one.
Data notes and limitations
All traffic, growth, and DR figures are third-party estimates (Similarweb-style traffic, Ahrefs-style Domain Rating) from our early-August 2026 snapshot, not first-party analytics from product owners. Pricing tags are set at listing time and can go stale — a product that switches from Freemium to fully Paid (or drops a paywall entirely) after being indexed won't be reflected here until its listing is updated, so treat these tags as directional snapshots rather than live pricing pages. Visits and growth statistics are computed only over the ~53–58% of each pricing group that currently has Similarweb visit-history data; the remainder isn't missing at random, but we can't characterize its pricing/traffic relationship from what we don't have. The category cross-tab covers Turbo0's ten largest category tags only, and a listing can carry multiple category tags, so category totals don't sum to the full pricing-group counts. We'll revisit this analysis as more listings accumulate traffic history.